Use of upconverting nanoparticles (UCNPs) as donors comes with some complications. Donor ions are characterized by their long lifetimes (hundreds of microseconds) and outnumber the acceptor dye molecules. On the contrary, the lifetimes of organic dye molecules are in the order of single nanoseconds. This results in a new landscape – where multiple-donors may interact with a single acceptor. Thus, a single dye molecule anchored to the nanoparticle (NP) surface can be “reloaded” with energy after emitting a photon.
Our work in the area of upconversion FRET involved volumetric measurements of liquid samples, resulting in an averaged readout of many FRET pair interactions. This approach involves an assumption, that the investigated samples are identical in concentration, both in the regard of the UCNPs and corresponding dye molecules. Currently, we are advancing beyond previous investigations, analyzing the single UCNP-dye molecule conjugates, quantitatively comparing their suitability for upconversion FRET biosensing. For this purpose, we have designed and built a new optical setup, to enable evaluating and comparing upconversion and FRET emission from single UCNPs. This custom laser scanning microscope is presented on Figure 1 below.
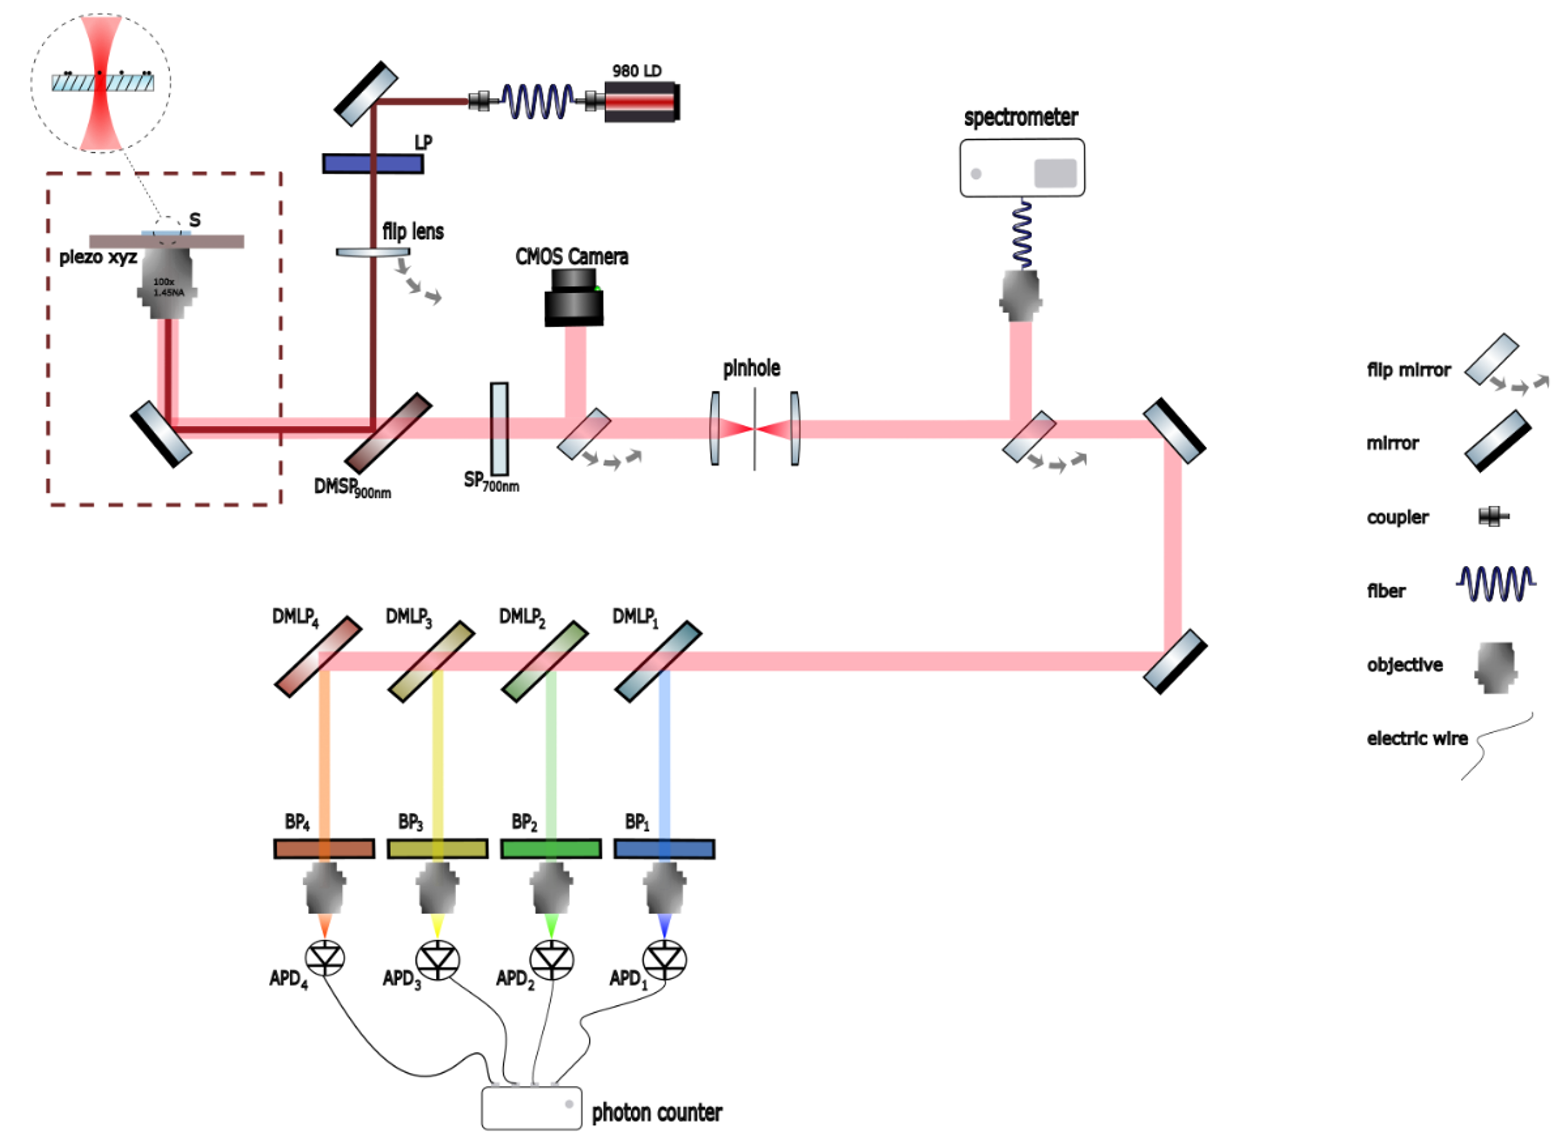
Figure 1. A scheme of the setup. S-sample, LP – long pass dichroic filter (@950nm). DMSPl – short pass dichroic mirror with transmission edge at l nm; DMLPi and BPi – long pass (LP) and band pass (BP) dichroic mirrors, which define spectra window recorded by subsequent APDi – avalanche photodiodes; the APDi generate single LVTTL pulses proportionally to photon flux up to 1 MHz, which are counted by the 8 CH photon counter for more advanced analysis.
Collecting photons emitted in an area of a diffraction-limited spot allows to analyze one UCNP at a time. We are using one of the most sensitive detectors available – avalanche photodiodes, which provide us with a reliable readout. This allows us to quantitively evaluate UCNP architectures for upconversion FRET applications on the single NP level. Hence, there is no further need for assuming that all samples are of equal concentration which greatly simplifies the quantitative analysis. The choice of 4 sets of filters – long-pass dichroics (DMLPi ) and narrow band-pass (BPi) depends on what are the activator ions inside of the UCNPs and what dyes are anchored to their surface. An appropriate set of filters allows to distinguish between different dye molecules (given that their emission peaks are spectrally separated) on a single UCNP level.
In laser scanning microscopy, a laser spot is being moved throughout the sample in a process called raster-scanning. We obtain a map of pixels, each pixel representing the emission intensity produced by a given diffraction limited point. Unfortunately, the beam has a diameter of 500 nm, while the UCNPs size vary between 10 and 50nm. This means that we cannot spatially resolve two or more UCNPs if they are displaced by less than ~300 nm. This results in a situation such as the one presented on Figure 2.
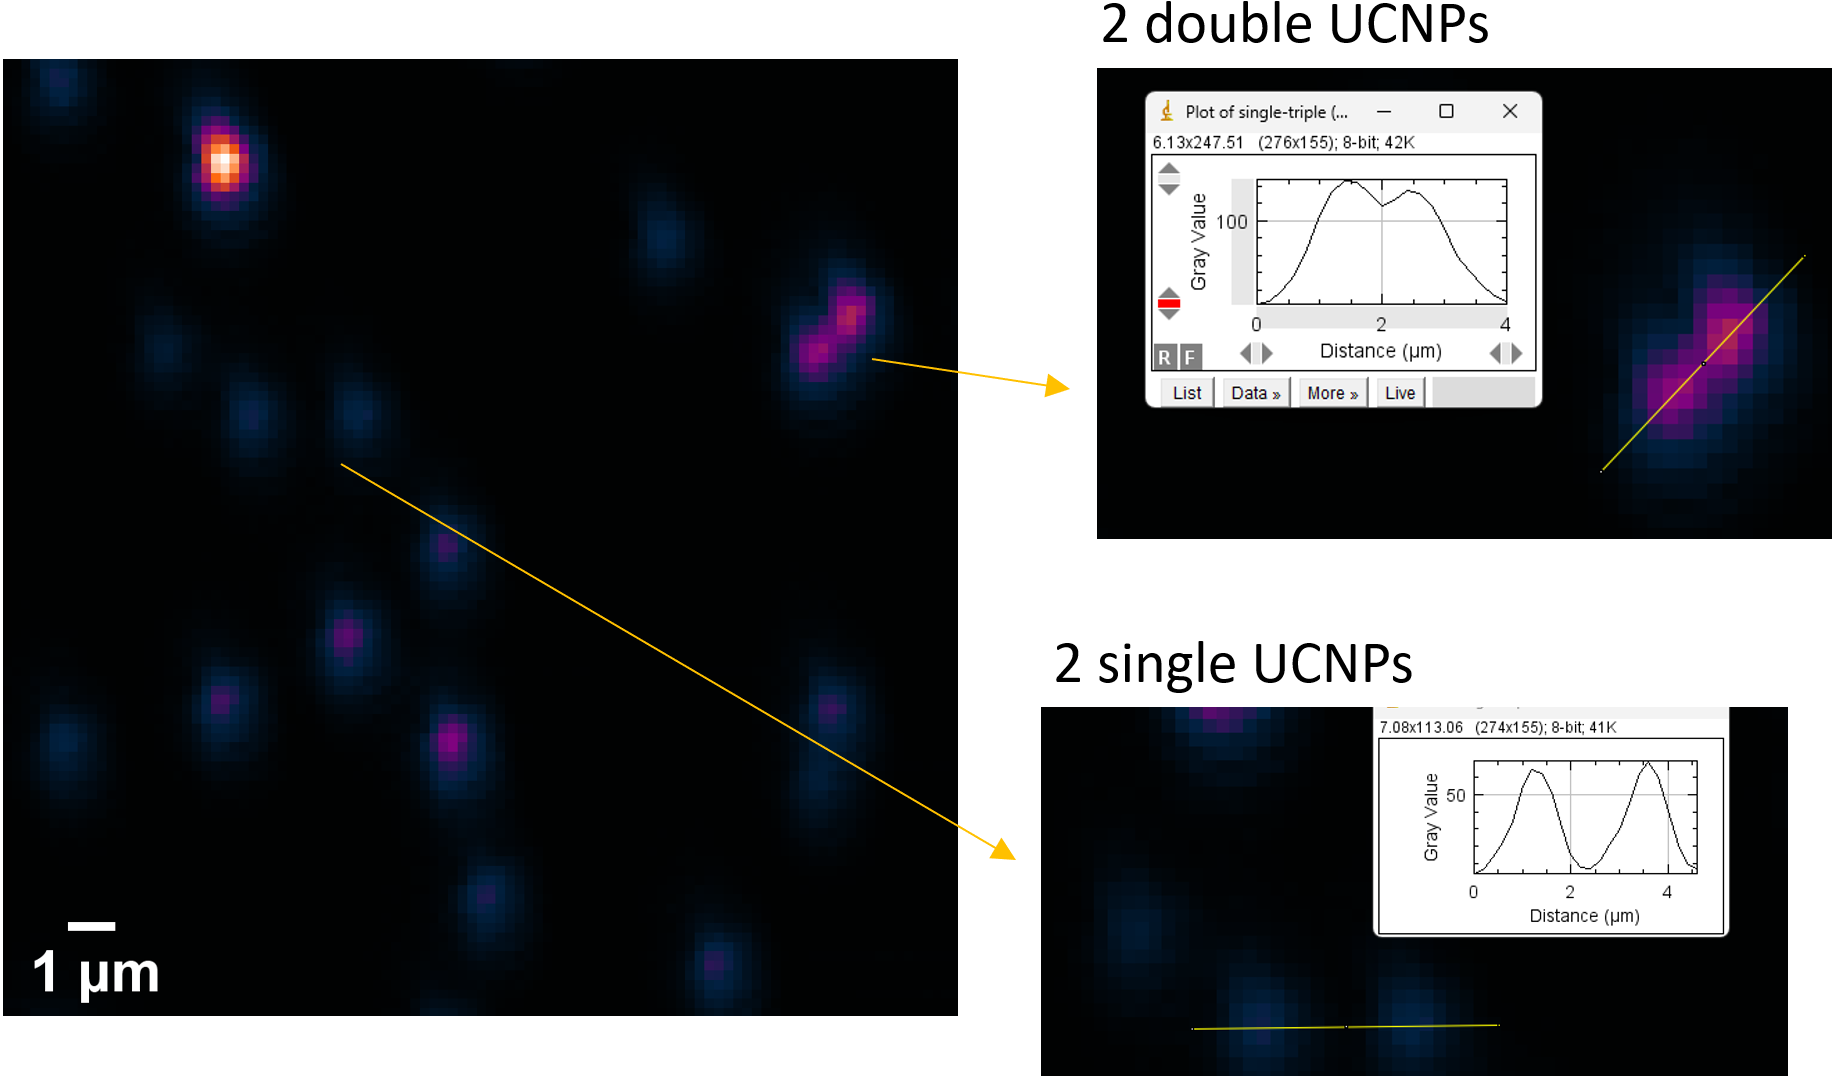
Figure 2. Laser scanning image of UCNPs. Arrows represent “zooming in” on an image and performing the intensity cross-section. We are able to find out what is the intensity Isingle corresponding to a single emitter – one UCNP. Two, three and more UCNPs located within the beam area result in integer multiple of that value, Isingle*N. Here Isingle ~ 60 and Idouble~ 120.
After fixing the laser beam in each position, we can collect spectra and perform time-resolved measurements for lifetime estimation.
Finally, we employed the setup to measure samples – well dispersed UCNPs with low concentrations of ATTO550 dye bound to their surface. We expected that the distribution of dye molecules would not be uniform, and that not every UCNP would contain dye molecules on their surface. We used two channels (two APDs and two filter sets) – first was collecting the intensity of UCNP (donor) emission, the other was collecting the dye (acceptor) emission. The obtained image is presented in Figure 3.
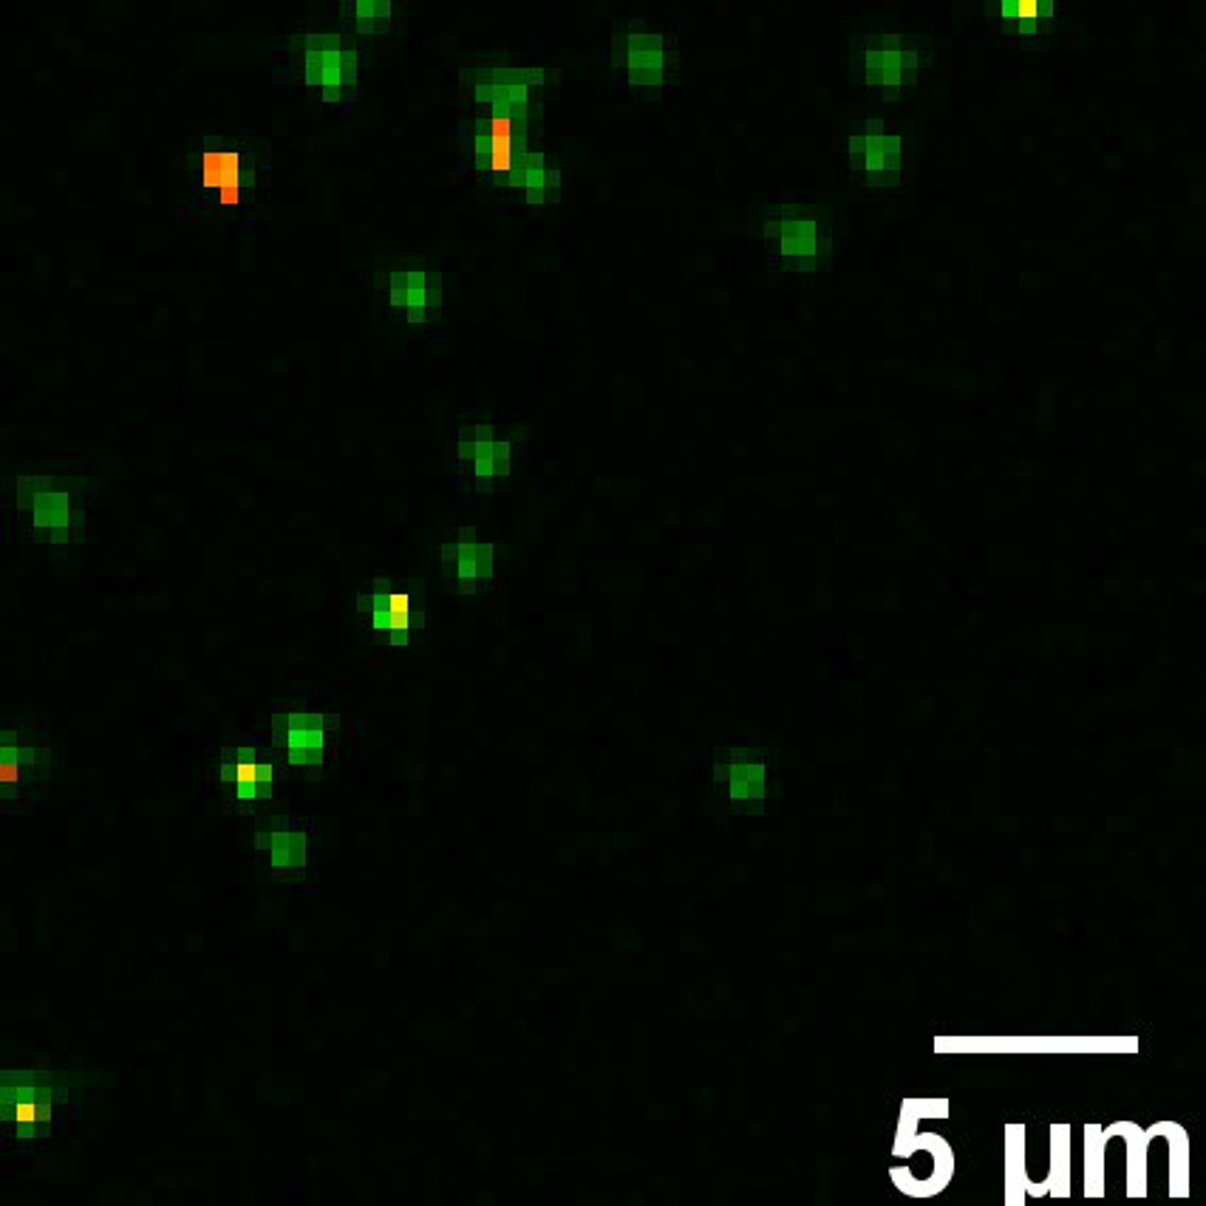
Figure 3. Two channel laser scanning image of UCNPs and dye emissions. The aggregation is limited, most of the UCNPs are spaced out, enabling single UCNP measurements. High (red)) and low (yellow) intensities of dye emissions are distinguishable.
We are currently testing the setup and optimizing it for the final 4 channel detection.
By Stanisław Okwiet